A battery cell first reveals its condition at the moment it is charged for the first time in the factory — the formation (activation) process. CATL’s US12540983B2 claims a method that pulls two numbers from that first charging curve to screen out cells short of electrolyte or contaminated with moisture. This article sets out the structure of the claims and the state of the family, and explains why merely renaming the statistical model may not be enough to design around it.
① What Is the Story
To put the point first: this patent has a narrow claim that limits the data, the features, the model, the decision and the action, but a design-around that swaps the decision model for a “Mahalanobis distance” produces the same decision boundary and may find it hard to escape an equivalence finding. US12540983B2 (priority 2022-04-19, granted 2026-02-03) claims a method that puts two feature values obtained from first-stage formation data into a two-dimensional Gaussian distribution model built from sample cells and, if the probability density is below a threshold, marks the cell as abnormal and removes it from subsequent production [1].
The industry setting brings the patent back into view. CATL began cell trial production at its plant in Debrecen, Hungary, on September 22, 2026, and according to the report the purpose of this stage is to set up, optimize and validate production equipment and manufacturing processes [2]. In validating a new line, formation data is the first quality signal to accumulate. Meanwhile, the Korean counterpart of this patent (KR102877176B1) is already granted, so it may bear directly on Korean cell makers and on suppliers of formation equipment and manufacturing execution systems (MES) [1].
The tension is that formation data analysis is becoming a standard feature for many suppliers. So the question this article answers is this: what exactly did CATL claim, and where is its boundary drawn?
② Basic Principles — The “ECG” of the First Charge and the Cloud of Normal Cells
The formation process is the stage in which a cell is charged for the first time to build a protective film (SEI) on the surface of the negative electrode. The interval in which the electrolyte decomposes and the film forms shows up as a peak in the curve of capacity change against voltage (dQ/dV). Just as an ECG waveform shows whether the heart is beating properly, the timing and shape of this peak show whether the first reaction took place normally. The patent specification states that experiments confirmed that cells with electrolyte abnormalities or abnormal water content show a markedly different course of parameter change from normal cells in the first stage of formation [1].
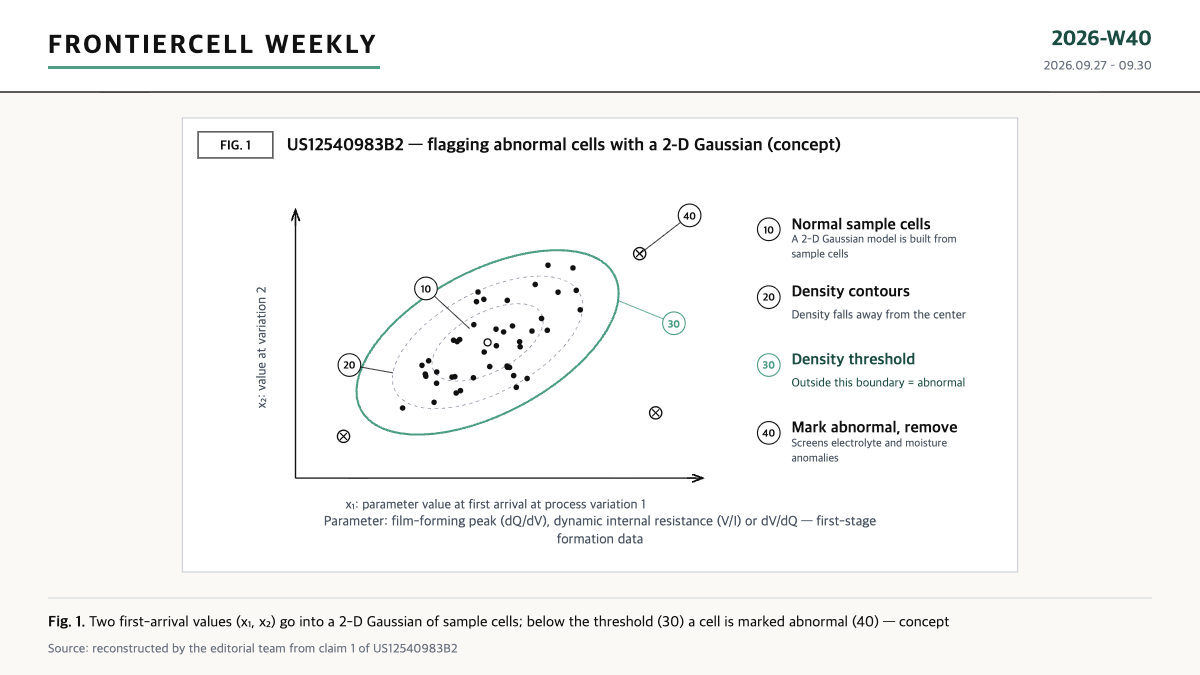
Source: reconstructed by the editorial team from claim 1 of US12540983B2
The feature this patent uses is the “first-arrival value.” In the first stage of formation, it finds the earliest moment at which the change between two consecutive samples equals a preset process variation (the specification gives the gradient value of the film-forming peak as an example), and records the parameter value at that moment. Doing this for two different process variations yields two numbers (x₁, x₂) for each cell [1].
Next comes the “cloud of normal cells.” If the (x₁, x₂) of the sample cells are gathered into a two-dimensional Gaussian distribution model, normal cells cluster densely near the center and the probability density falls with distance. If a new cell’s probability density is below the threshold — that is, if it lies outside the edge of the cloud — it is judged abnormal, marked, and removed from subsequent production [1].
③ Comparison — Claim 1 Elements Mapped
| Claim 1 element (paraphrased) | Construction point | Room to design around (possibility) |
|---|---|---|
| (a) Decide from target feature data whether a cell is abnormal; if so, mark it and remove it from subsequent production | Decision through marking and removal forms one flow | Monitoring only, without marking, leaves room to argue a difference |
| (b) The feature data is generated in the formation process and distinguishes abnormal from normal cells | Limited to formation-process data | Data from other processes such as aging may fall outside the wording |
| (c) The parameter is one of film-forming peak (dQ/dV), dynamic internal resistance (V/I) or dV/dQ | An enumerated list of three | Using another parameter may fall outside the wording |
| (d) Two parameter values at the first arrival at two different process variations | First arrival = the earliest point in the first formation stage at which the difference between consecutive samples equals the variation | Other features such as mean or maximum leave room to argue a difference |
| (e) Feed the two values into a 2-D Gaussian model built from sample cells and calculate the probability density | The type of model is specifically limited | A Mahalanobis distance threshold draws the same elliptical boundary — room for equivalence |
| (f) Judge the cell abnormal if the density is below a threshold | The threshold method is stated | A one-dimensional threshold or rule-based decision may be a different path |
Source: reconstructed by the editorial team from claims 1–4 and the specification of US12540983B2
What this table shows: claim 1 is a narrow structure that limits the type of data (first stage of formation), the features (two first-arrival values), the model (two-dimensional Gaussian), the decision (density threshold) and the action (marking and removal). There are several design-around routes, but merely renaming the model may find it hard to avoid an equivalence finding on elements (e) and (f).
④ Patent Perspective — A Narrow Claim, but the Same Boundary
Bibliography and filing flow. The assignee of US12540983B2 is shown as Contemporary Amperex Technology Hong Kong Ltd. Based on a Chinese PCT application of April 19, 2022 (PCT/CN2022/087736, WO2023201531A1), it entered the United States on March 4, 2024, was published on August 1, 2024 (US20240255581A1) and granted on February 3, 2026. Google Patents shows an adjusted expiration date of July 16, 2042. There are seven claims, with the method (claim 1), an electronic device (claim 5), a recording medium (claim 6) and an apparatus for identifying cells with electrolyte abnormalities (claim 7) each forming a separate category. The dependent claims add electrolyte-influenced features (claim 2), water-content-influenced features (claim 3) and making the decision during the formation process (claim 4) [1].
State of the family. From the same priority came China’s CN117413195A (published 2024-01-16), Japan’s JP7697141B2 (2025-06-23) and Korea’s KR102877176B1 (2025-10-28), while Europe’s EP4382937A1 was published on June 12, 2024 and a supplementary search report (A4) followed on May 7, 2025 [1]. The rights are settled in the United States, Japan and Korea, and still under examination in Europe.
Source: reconstructed by the editorial team from claim 1 of US12540983B2 (at the level of possibility)
Key insight — switching to Mahalanobis distance leaves the boundary unchanged. The probability density of a two-dimensional Gaussian is a function only of d², the square of the Mahalanobis distance from the center. Written as a formula, p(x) = exp(−d²/2) / (2π·|Σ|1/2), where d² = (x−μ)TΣ−1(x−μ). The condition “the probability density is below a threshold” therefore produces exactly the same elliptical boundary as “the Mahalanobis distance is greater than some constant.” Even if a supplier explains that “we use a distance criterion, not a Gaussian density,” it may be exposed to an argument under the doctrine of equivalents that function, way and result are substantially the same (the function-way-result test since Graver Tank in the United States) [3]. Any design-around should change the shape of the decision boundary and the input features, not the name of the model.
The reality of enforcement. A data-processing method that runs inside a factory is hard to prove infringed from the outside. In that respect, the device and medium claims (claims 5–7) become a channel that can target those who supply software or equipment carrying the screening function. In Korea the wording of the Korean granted claims must be checked separately, but equipment and MES suppliers may become the first subjects of an FTO (freedom-to-operate) review.
Design-around scenarios (counterarguments). First, change the features. Using other features such as the position or area of the peak instead of first-arrival values leaves room to argue a difference from element (d). Second, change the stage. Screening by the voltage drop in the aging stage (K-value) rather than the first stage of formation may fall outside element (b). Third, change the decision. A one-dimensional threshold on a single parameter, or a rule-based decision, follows a different path from (e) and (f). Formation curve analysis itself, however, has long been used in academia and industry, so prior art that could challenge this patent’s novelty or inventive step may also exist.
⑤ Limits and Outlook
Counter-scenario: if the claim is narrow enough for competitors to sidestep easily, the real value of this patent may lie closer to a defensive role — creating prior art through disclosure — than to a licensing tool. Conversely, if formation data analysis standardizes around Gaussian and Mahalanobis-type anomaly detection, a claim that looked narrow may reach a wide range of practice.
Strategic alternative: Korean cell makers and equipment suppliers would be safer documenting, when they design formation screening logic, both the feature definition (what is extracted) and the decision boundary (what shape it cuts), and confirming whether different combinations of features deliver the same screening performance.
Practical action: download the original granted claims of KR102877176B1 from KIPRIS, compare their wording with US claim 1, and map the features, model and threshold method of your own formation screening logic one-to-one onto elements (a)–(f) in the table.
This article is a technology and patent commentary based on public sources and is not legal advice on any specific matter.
Items Requiring Verification
- The difference between the wording of the granted claims of KR102877176B1 and the US claims was not checked.
- The current examination status of EP4382937A1 needs to be checked.
- Specific values of the process variation may differ between embodiments. The specification gives the gradient value of the film-forming peak as an example.
- Whether this method is actually used in CATL plants was not found in public sources.
- No prior-art search was carried out to judge the possibility of invalidity.
Sources
- Google Patents, US12540983B2 “Method and apparatus for identifying abnormal battery cell, electronic device, and storage medium,” bibliographic data, claims 1–7, specification and family list (original checked 2026-09-27).
- CnEVPost, “CATL begins trial cell production at planned 100 GWh Hungary plant,” 2026-09-22. Article link
- Graver Tank & Mfg. Co. v. Linde Air Products Co., 339 U.S. 605 (1950).
Related Reading
- How a Battery Cell Is Made — Electrode, Assembly, and Formation, and the Patents Attached to Each Step
- Inspection That Watched the Surface Has Started Looking Inside — Where Battery Total Inspection Turns Radiographic
- [Patent Analysis] Electrode Tab-Lead Weld Inspection: X-ray + Deep Learning (TechDial) vs. Ultrasonic + AI (LG Energy Solution) Head-to-Head
FRONTIERCELL WEEKLY · 2026-W40 (2026.09.27–09.30)
More from this week’s Frontiercell Weekly
- Twice a Day for 25 Years — The 18,250 Cycles a Jeju ESS Contract Asks of a Cell (published Sept 27)
- [Patent Analysis] When an Augmentation Decision Becomes a Claim — The Boundary of ESS Capacity Management in Fluence US12632024B2 (published Sept 28)
- The Equipment Arrived in Spring, the Cells in Autumn — What CATL’s Debrecen Trial Production Shows About a European Plant’s Critical Path (published Sept 29)