Too little electrolyte in a cell is a problem, and so is too much. This article explains why the yardstick for electrolyte quantity is shifting from the ‘fill amount’ to ‘the amount that stays inside the electrode pores,’ and looks at a patent that fenced this idea in with numbers.
① What’s the Topic
The core of electrolyte-quantity design is not ‘how much was injected’ but ‘how much stays relative to the empty space in the electrodes.’ Inject the same amount into electrodes with different pore structures, and one cell slowly dries out while another overflows.
Start with the industry context. In a lithium-ion battery, the electrolyte is the liquid pathway that carries lithium ions between the cathode and the anode. Near the end of cell manufacturing there is an electrolyte filling step, in which electrolyte is injected into the assembled cell. The value expressing how many grams are injected per 1 Ah of cell capacity is commonly called the electrolyte-to-capacity ratio, or E/C ratio (g/Ah). As the energy-density race intensifies, the pressure grows to strip ‘weight that stores no electricity’ out of the cell, and electrolyte is one of the targets.
The tension runs both ways. With too little electrolyte, parts of the electrode surface stay dry, the ion pathway breaks, and resistance rises. With a generous fill, cell weight and cost both increase and specific energy (energy per unit weight) falls[2]. On top of that, electrolyte is gradually consumed during cycling to build and repair the protective film on the anode surface, the Solid Electrolyte Interphase (SEI). An amount that was ‘just right’ at the start can become too little late in life.
So the question this article answers is this: What should the right amount of electrolyte be based on, and how has a patent turned that basis into a right?
② Basic Principle — The Electrode Is a Sponge, the Electrolyte Is Water
An electrode is a porous layer made of active-material particles, conductive additive, and binder bound together. Between the particles are tiny empty spaces, called voids or pores, and the separator also has pores. Only when electrolyte fills these spaces do they become ion pathways. Think of a kitchen sponge: the sponge is the electrode, and the water is the electrolyte.
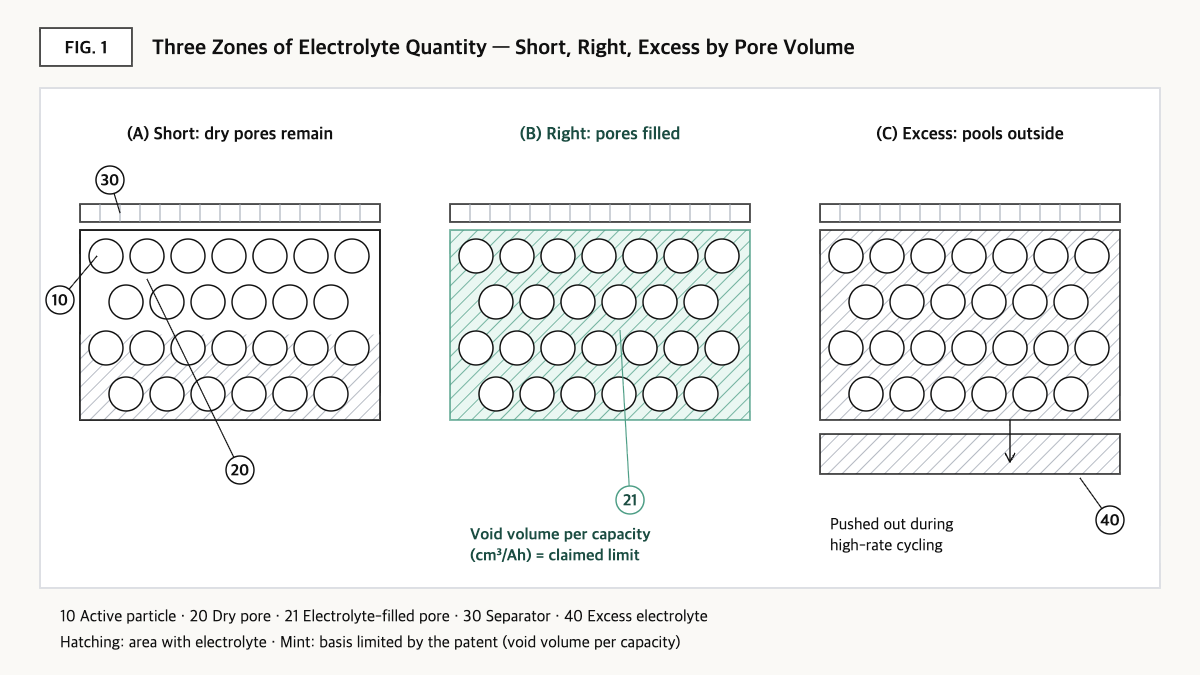
Source: reconstructed by the editorial team from the ORNL study (2017), Millares et al. (2023), and the specification of US9917296B2.
Pour only a little water on a sponge and dry corners remain. In battery terms, the unwetted parts of the electrode cannot take part in the reaction, and only the wetted parts are overworked. Pour too much, and the water the sponge cannot hold pools at the bottom of the bowl. This ‘pooled water’ adds weight but does no work.
There is one more phenomenon. Squeeze a sponge and release it, and the water it holds is wrung out. An electrode, too, pushes electrolyte out of its pores as the active material expands and contracts with every charge and discharge. Especially under high-rate conditions, where the cell is charged and discharged quickly at high current, electrolyte pushed out of the electrode layer can make the ion distribution inside the electrode uneven, and resistance may rise as a result[3]. In other words, the electrolyte problem is not only about ‘total amount’ but also about ‘where it stays.’
For this reason, researchers often express electrolyte quantity not relative to cell capacity but as a multiple of the total pore volume of the electrodes and separator, known as the electrolyte volume factor. It sets what the sponge can hold as 1 and asks how many times that amount was added.
③ Comparison — Three Yardsticks for Electrolyte Quantity
| Metric | Definition | Values in public sources | Main use |
|---|---|---|---|
| E/C ratio (g/Ah) | Mass of injected electrolyte ÷ cell rated capacity | No standard value by cell format in the public sources checked for this article (qualitative) | Filling process control, cost estimation |
| Electrolyte volume factor (times) | Electrolyte volume ÷ total pore volume of electrodes and separator | Minimum 1.9 times needed for long-term cycling in graphite/NMC532 pouch cells[1]; 1.5 times was the balance point of capacity retention, resistance, and specific energy after 200 cycles in graphite/NMC811 single-layer pouch cells[2] | Cell design validation, research comparison |
| Void volume per capacity (cm³/Ah) | Void volume of active material layer ÷ battery capacity | Cathode 1.00–2.20, anode 2.17–3.27, cathode value < anode value[3] | Numerical limitations in patent claims |
Source: reconstructed by the editorial team from the ORNL study (J. Electrochem. Soc. 164(6), 2017)[1], Millares et al. (MRS Advances, 2023)[2], and the claims of US9917296B2[3]. The E/C ratio row is a qualitative comparison.
What this table shows: The ‘right amount of electrolyte’ varies with research conditions, such as 1.9 times[1] versus 1.5 times[2], so it is hard to state as a single number. The patent, by contrast, limits not the electrolyte itself but the ‘container (voids)’ that holds it, divided by capacity[3].
This difference may look minor, but in practice it is significant. The E/C ratio is a process value managed on the production floor, and it is hard to verify precisely after the fact by opening a finished cell, because part of the electrolyte is consumed during formation (the first charge that builds the SEI) and some escapes as gas. The void volume of the active material layer, by contrast, is a ‘structural’ value that can be measured in the finished product.
④ Patent Perspective — Claiming Not the Electrolyte but ‘the Container That Holds It’
A good example of this perspective is Toyota Motor Corp’s US patent US9917296B2 (title: Nonaqueous electrolyte secondary battery). The inventor is Koji Takahata; the priority date is 2014-04-02 (Japanese application 2014-076355), the filing date (PCT international filing date) is 2015-04-01, and the grant date is 2018-03-13. The current assignee is Toyota Motor Corp; according to Google Patents, the legal status is Active (anticipated expiration 2035-04-13), with 6 granted claims[3]. The specification addresses the problem of electrolyte being pushed out of the active material layer and resistance rising when high-rate charging and discharging at 2C or more, especially 5C or more, is repeated.
Restating claim 1 element by element, without reproducing the original wording, gives the following.
| Claim 1 elements (restated) | Meaning for the scope of rights |
|---|---|
| (a) A cathode having a cathode active material layer | Conventional element — little limiting effect |
| (b) An anode having an anode active material layer | Conventional element |
| (c) A nonaqueous electrolytic solution | Conventional element — electrolyte composition and amount are not limited |
| (d) Void volume α of the cathode active material layer per battery capacity is 1.00 or more and 2.20 or less (cm³/Ah) | Numerical limitation ① — the window for the cathode-side ‘container size’ |
| (e) Void volume β of the anode active material layer per battery capacity is 2.17 or more and 3.27 or less (cm³/Ah) | Numerical limitation ② — the window for the anode-side ‘container size’ |
| (f) α is smaller than β | A limitation fixing the electrolyte allocation between cathode and anode — the branching point of infringement analysis in the range where the two windows overlap (2.17–2.20) |
Source: reconstructed by the editorial team from the bibliographic data and claim structure of US9917296B2 on Google Patents (the original claim wording and drawings are not reproduced).
The dependent claims narrow α to 1.15 or more and 1.30 or more, narrow the α/β ratio to 0.35–0.88 and then 0.52–0.71, and limit the average pore size of the cathode active material layer to 0.25–0.55 μm[3]. According to the description of the experimental results in the specification, cells satisfying the three conditions of claim 1 had low initial resistance and a resistance increase after the high-rate cycle test suppressed to 125% or less, and when α/β was 0.52–0.71, it was suppressed further to 105% or less[3].
The axis of the scope of rights is clear. This claim does not ask how much electrolyte was injected. It asks how much room for electrolyte was provided relative to capacity, and whether more was provided on the anode than on the cathode. This means that even if the fill amount changes, the risk of infringement may remain as long as the void structure is the same.
Sketching design-around scenarios, the following could be considered: ⓐ calendering the anode harder to bring β below 2.17, ⓑ enlarging cathode voids to push α above 2.20, and ⓒ reversing the void allocation between cathode and anode so that α is equal to or greater than β. There are counterarguments. Options ⓐ and ⓑ trade off energy density or electrolyte retention, so avoiding the patent could mean taking back the very high-rate resistance-increase problem the patent set out to solve. Also, because the same cell can yield different values depending on how ‘void volume’ is measured, the measurement conditions defined in the specification should be confirmed before any freedom to operate (FTO) judgment. Numerical-range claims may be interpreted as making it difficult to apply the doctrine of equivalents to values outside the range, but this too could vary from case to case.
Cross-check of similar patents: within the scope of this search, no granted patent was confirmed from the original text that limits, in an independent claim, the electrolyte mass divided by capacity (g/Ah) itself. On the filling-process side, patents dealing with ‘how to inject’ exist separately, such as US10476097B2, which claims the order of the reduced-pressure cycle during filling, so electrolyte-related rights can be seen as split into two branches: ‘how to inject’ and ‘the structure that holds it.’
⑤ Limits and Outlook
Optimistically, reducing electrolyte to match the pore volume is a relatively easy way to raise specific energy and lower cost. In the graphite/NMC811 cell study, too, the 1.5-times condition was presented as a point that secured both performance and specific energy[2].
There is also an opposing scenario. Electrolyte that was ‘sufficient’ in initial performance tests could become insufficient late in life. The more a material that repeatedly re-forms SEI is blended in, such as a silicon-based anode with large volume change, the faster electrolyte consumption could become. In that case, an optimum set by a test of a few hundred cycles may fall short in vehicle and ESS applications that require thousands of cycles. The very fact that a result requiring a minimum of 1.9 times[1] coexists with a result finding 1.5 times to be the balance point[2] is a signal that the right value is sensitive to materials and test conditions.
A strategic alternative is to manage electrolyte quantity not as a single process value but in three layers: ‘fill amount + electrode void design + consumption over life.’ Void design in particular is a structural value that can become the subject of rights, as in this patent, so recording it together with the measurement method at the R&D stage makes it useful both for building one’s own rights and for responding to others’ rights.
Action to check (planning/IP teams): In your own or a supplier’s cell specification, do not look only at the fill amount (g/Ah); request the void volume of the cathode and anode active material layers divided by battery capacity (cm³/Ah) and compare it one-to-one with the scope of claim 1 of US9917296B2 (cathode 1.00–2.20, anode 2.17–3.27, cathode < anode). Because comparison results may differ if the measurement method differs, obtain the measurement conditions as well.
Items Requiring Verification
- Representative E/C ratio (g/Ah) values by cell format for commercial EV cells could not be confirmed from public sources, so the table uses a qualitative comparison instead of numbers.
- The detailed measurement conditions for void volume defined in the specification of US9917296B2, and the grant status and claim scope of corresponding family members in Japan, China, and elsewhere, were not checked in this article.
- Quantitative values for electrolyte consumption rate by silicon-based anode ratio were not confirmed from original sources in this search.
- Whether a granted patent exists that directly limits electrolyte mass/capacity (g/Ah) in an independent claim requires further searching.
Sources
- Oak Ridge National Laboratory, “Correlation of Electrolyte Volume and Electrochemical Performance in Lithium-Ion Pouch Cells with Graphite Anodes and NMC532 Cathodes,” Journal of The Electrochemical Society 164(6), 2017, DOI 10.1149/2.1131706jes. Link
- Millares et al., “Optimization of electrolyte volume in lithium-ion pouch-type cells,” MRS Advances, 2023, DOI 10.1557/s43580-023-00565-7. Link
- Google Patents, US9917296B2 “Nonaqueous electrolyte secondary battery,” bibliographic data, claims, and specification (original checked 2026-09-23). Link
This article is a technology and patent trend commentary, not legal advice. Specific FTO judgments require professional review.
Related Reading
- [Patent Analysis] Filling Electrolyte ‘Atmospheric-Pressure First,’ Not ‘Vacuum First’ — The Claim Boundary of the Reduced-Pressure Cycle Drawn by US10476097B2
- Why Do Pouch Cells Seem to Swell So Much? — The Structural Reason for Swelling
- Electrolyte, From Liquid to Solid — The Safety-vs-Interfacial-Resistance Tradeoff