Internal resistance is written as a single number on a cell datasheet, but it mixes three resistances of entirely different character. This article sets out where ohmic, charge-transfer and diffusion resistance arise and which design variables they respond to, and reads the claim boundary of “how resistance is split” through a granted BMW patent that first separates the series resistance with a high-frequency measurement.
① What’s the Topic
“A 10% rise in internal resistance” is a symptom, not a diagnosis. Only by seeing in which frequency band and which time window it rose can one decide whether to fix the electrolyte, the interface or the electrode structure.
Start with the industry context. A cell’s power, heat generation and fast-charging limit all converge on internal resistance. Datasheets typically list, in a single line, the 1kHz AC resistance (AC-IR) or the DC resistance measured with a pulse of fixed duration (DC-IR, DCIR). Yet this number measures entirely different things depending on the method. The 1kHz AC resistance gives a fair estimate of ohmic resistance in cells of several Ah[2], whereas DC resistance with a long pulse also pulls in slowly responding components.
The tension lies in the fact that cell design changes move these components differently. Thickening electrodes or pressing them harder to raise density increases through-thickness ion-transport limitations[4][5], and lower temperature raises electrolyte resistance[1]. In one measurement case, the value obtained by a 10-second DC resistance differed by only 20% in overall resistance, but when the diffusion resistance alone was isolated, the estimate differed by a factor of five[2]. Looking at a single number can mean pointing to the cause backwards.
The question this article answers is this: Into which components does internal resistance divide, which design variables does each respond to, and how far is the decomposition method itself tied up in patents?
② Basic Principle — Internal Resistance Is “the Three Reasons You’re Late for Work”
Picture the morning commute. Lateness usually has three causes. The time to open the front door appears immediately and is always the same. The subway ticket gate jams briefly when people crowd in but soon clears. The crowded transfer corridor only reveals its delay after a long walk. A cell’s internal resistance can likewise be divided into three components with different response speeds.
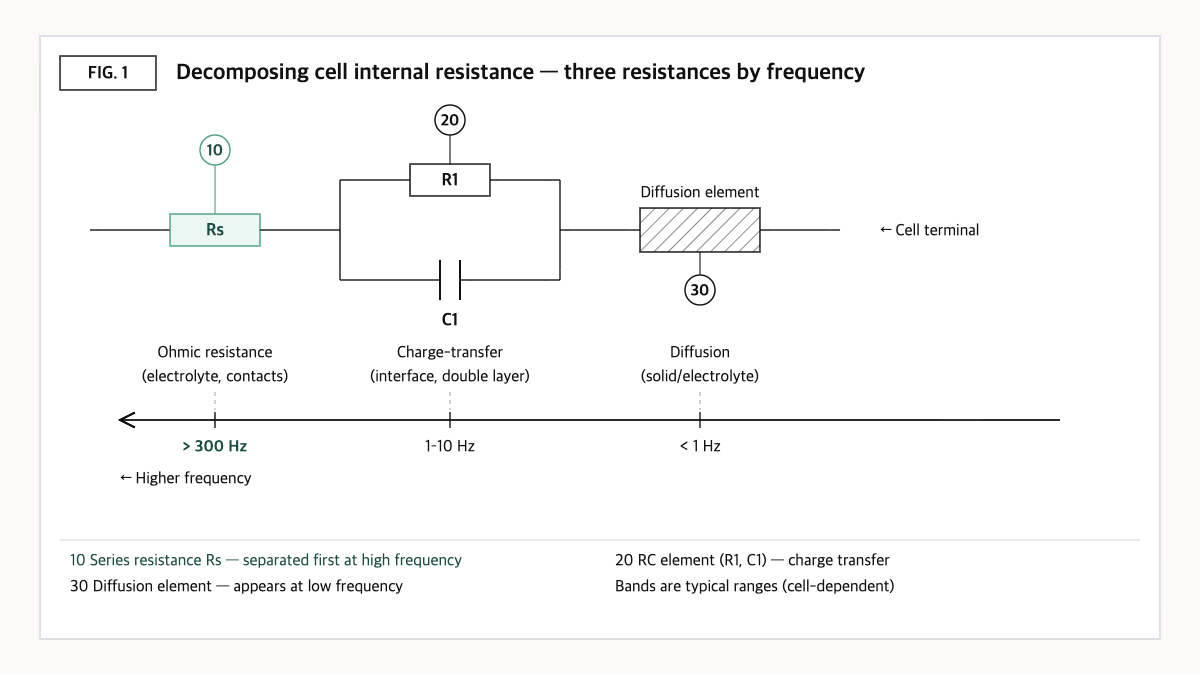
Source: reconstructed by the editorial team from the US12055593B2 specification and technical material on internal resistance measurement.
First, ohmic resistance is the resistance that appears the instant current flows. Most of it is electrolyte bulk resistance, and it stands out at high frequencies of several hundred Hz and above[2]. Second, charge-transfer resistance is the threshold of the reaction in which lithium ions exchange electrons at the electrode surface. Paired with the capacitance of the surface double layer, it typically shows up in the 1–10Hz band[2]. Third, diffusion resistance arises as ions move slowly through the electrolyte and particles, and typically dominates below 1Hz[2].
So the speed of the measurement signal decides what is measured. A fast-oscillating signal sees only the front door (ohmic resistance), and the slower the oscillation, the more the ticket gate (charge transfer) and the transfer corridor (diffusion) are added in. This is also why DC pulse measurements conventionally use values at 0.1 seconds, 1 second and 10 seconds[2]. The moment a pulse length is chosen, one is in effect choosing which resistance to call “internal resistance.”
③ Comparison — Frequency, Physics and Design Variables of the Three Resistances
| Axis | Ohmic resistance | Charge-transfer resistance | Diffusion resistance |
|---|---|---|---|
| Dominant frequency band (Hz) | Several hundred Hz and above[2] | Typically 1–10Hz[2] | Typically 1Hz or below[2] |
| Main physics | Mostly electrolyte bulk resistance[2] | Electrode interface reaction and double-layer capacitance[2] | Slow kinetics of ion diffusion[2] |
| Responsive design/operating variables | Electrolyte resistance depends mainly on temperature and state of health (SOH)[1] | Interface reaction area, temperature (qualitative) | Electrode thickness, porosity, tortuosity[4][5] |
| Measurement caution | 1kHz AC resistance gives a fair estimate of ohmic resistance in cells of several Ah[2] | Represented by the RC element of the equivalent circuit (patent claim)[1] | In a 10-second DC resistance case, the diffusion-resistance estimate differed fivefold[2] |
Source: reconstructed by the editorial team from the US12055593B2 specification and claims[1], a Keysight technical blog[2], and the US8993159B2[4] and US9065093B2[5] specifications.
What this table shows: Ohmic resistance appears at several hundred Hz and above, charge transfer at 1–10Hz and diffusion at 1Hz or below, so comparing “internal resistance” without fixing the measurement frequency or pulse length can mean comparing different components. The diffusion component in particular can have estimates that diverge severalfold depending on the method, making it the item requiring the most care in design comparisons.
④ Patent Perspective — The Order “Separate First Above 300Hz, Then Solve the Rest” Became a Right
The key patent is US12055593B2 (title: Method for parameter estimation in an impedance model of a lithium ion cell) held by BMW (Bayerische Motoren Werke AG). Its priority date is 2019-10-10 (German application 10 2019 127 384.6), its PCT filing date is 2020-09-24, it was published in the US (US20240085485A1) on 2024-03-14 and granted on 2024-08-06; its legal status on Google Patents is Active (anticipated expiration 2040-09-24), with 9 granted claims[1].
One term first. An equivalent circuit is a model that mimics a cell’s electrical response with a combination of circuit elements such as resistors and capacitors. This patent takes as its basic configuration a series resistance Rs and an RC element in which resistance R1 and capacitor C1 are connected in parallel. The specification describes Rs as electrolyte resistance depending mainly on temperature and state of health, and the RC element as representing electrode processes and charge transfer, and the double-layer capacitance at the electrode interface[1].
| Elements of claim 1 (restated) | Meaning for the scope of rights |
|---|---|
| (a) A method of determining parameters of an equivalent circuit (R1 and C1 of at least one RC element, and series resistance Rs) representing the impedance of a lithium-ion cell | Method claim — who performs the parameter-estimation procedure matters |
| (b) Measuring at least the real part of the impedance at a first frequency above 300Hz | Key limitation — fixes a high-frequency threshold (300Hz) numerically and starts from that measurement |
| (c) Determining the series resistance Rs from the measured real part | Order limitation of “Rs first” |
| (d) Additionally measuring real and imaginary parts, or magnitude and phase, at one or more frequencies lower than the first frequency | Broadly allows the form of low-frequency measurement |
| (e) Subtracting at least Rs from the result of the additional measurement | Sequential subtraction structure — may become an axis distinguishing it from simultaneous fitting |
| (f) Determining R1 and C1 from that result | Limits the final output |
Source: reconstructed by the editorial team from the claim structure of US12055593B2 (original claim wording and drawings not reproduced verbatim).
The dependent claims pull this procedure toward the vehicle. Claim 3 adds a step of subtracting the series inductance component arising from wiring and structure, and claim 5 limits a combination using the zero-crossing and extreme-value frequencies of the Nyquist plot and a frequency in the 10–50Hz band. Claim 8 claims a monitoring method that applies temperature and SOC to the parameters thus obtained to judge state of health and forecast future power characteristics, and claim 9 claims a battery system and BMS equipped with their own signal generator, without an external excitation signal[1]. It reads as a portfolio aimed not at a laboratory measurement method but at on-board impedance diagnostics.
Design-around scenario (with counterargument): On a literal reading, the two clearest design-around axes are these. One is “above 300Hz” in (b). Deriving the series resistance from a measurement at 300Hz or below, or from a time-domain pulse response, may fall outside the literal scope. The other is the sequential structure of (c)–(e). A simultaneous-fitting approach that fits all parameters at once from the full set of multi-frequency measurements leaves room to argue that it differs from the element “determine Rs first and subtract it.”
The counterargument is clear too. Even with simultaneous fitting, if in substance the high-frequency real part determines Rs and that value is removed in the low-frequency analysis, the range of equivalents could be disputed. Also, since claim 1 is a method claim, the judgment of who is the infringing party may vary depending on whether the cell maker, the BMS supplier or the automaker performs the procedure, so it is safer to settle responsibility in supply-chain contracts in advance.
Cross-check of similar patents: US11163009B2 from LG Energy Solution (original applicant LG Chem) claims an estimation apparatus that corrects measured resistance using the increase/decrease rate of beginning-of-life (BOL) resistance according to charge/discharge conditions[3]. It is a right on the DC-resistance-correction side rather than frequency decomposition, so its axis differs from the BMW patent, but it shows that “how resistance is calculated inside the BMS” is finely divided among several companies’ rights.
⑤ Limits and Outlook
On the optimistic side, viewing resistance by component could become a common language linking cell design and operation. At the design stage one can track separately how much a change in electrode thickness or density enlarges the diffusion component, and at the operating stage how much temperature and aging move the ohmic component. If on-board impedance diagnostics spread, this data may also accumulate in real time.
There is also a counter-scenario. Equivalent-circuit decomposition depends on the model. The same spectrum may yield different component values depending on how many RC elements are used or how the diffusion element is represented, and frequency bands also shift with cell size and temperature[2]. Add the noise of the vehicle environment, and component values may not be stable enough to support design decisions.
The strategic alternative is to manage internal resistance as a “component-level resistance budget with a fixed measurement protocol.” For example, listing the high-frequency real part, the mid-frequency arc and the long-pulse increment as separate items on the datasheet, with temperature, SOC and measurement frequency fixed together, allows the effect of design changes to be compared component by component. At the same time, it should be checked whether in-house decomposition algorithms overlap the procedural claims of outside patents.
Action to check (planning/IP teams): Write out step by step the procedure your BMS or cell-evaluation software uses to decompose impedance, and compare it one-to-one with the order in US12055593B2 claim 1: “derive Rs from the real part above 300Hz → subtract Rs from low-frequency measurements → derive the RC parameters.” If they overlap, it is advisable to note the party performing the procedure (your company, a supplier or a customer) and request a freedom-to-operate (FTO) review.
Items Requiring Verification
- The frequency bands (several hundred Hz and above, 1–10Hz, 1Hz or below) are typical values from a single technical blog; actual bands by cell format, capacity and temperature were not separately checked.
- The family composition of US12055593B2 in Europe, China and elsewhere, and its grant status, were not checked.
- For US11163009B2, only bibliographic data and the abstract were checked; the elements of claim 1 were not reviewed in detail.
- The design-variable link that charge-transfer resistance responds to interface reaction area and temperature has no numerical basis in the sources checked this time, so it is described qualitatively.
Sources
- Google Patents, US12055593B2 “Method for parameter estimation in an impedance model of a lithium ion cell,” bibliographic data, specification and claims 1–9 (original checked 2026-09-23). Link
- Ed Brorein, “A Deeper Look at Lithium-Ion Cell Internal Resistance Measurements,” Keysight technical blog, 2022. Link
- Google Patents, US11163009B2 “Apparatus and method for estimating resistance of battery,” bibliographic data and abstract (checked 2026-09-23). Link
- Google Patents, US8993159B2 “Semi-solid electrodes having high rate capability,” specification background (checked 2026-09-23). Link
- Google Patents, US9065093B2 “Controlled porosity in electrodes,” specification (checked 2026-09-23). Link
This article is a technology and patent trend commentary, not legal advice. Specific FTO judgments require professional review.
Related Reading